
Pressure Mapping for Sports Rehab
Jun 12, 2026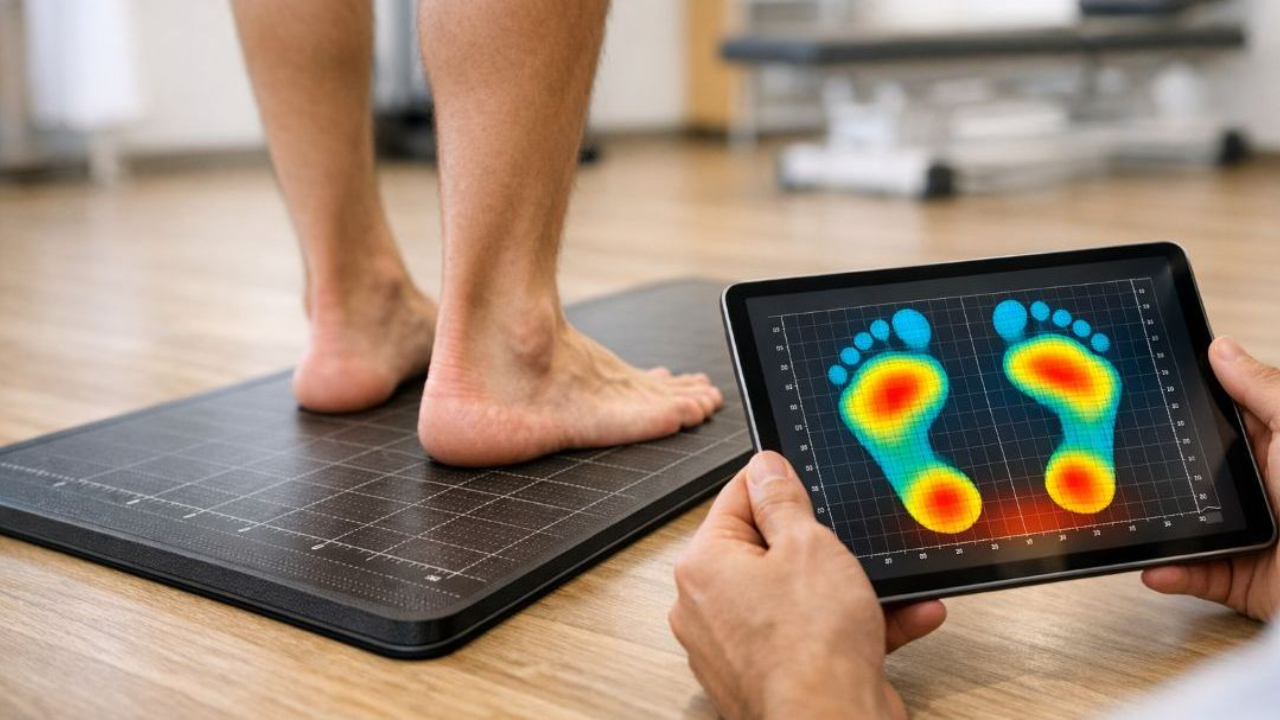
Pressure mapping is a tool that measures how force is distributed across the foot during movement. It helps identify hidden biomechanical issues that may lead to injuries. Clinicians use it to analyze load patterns, guide treatment, and track recovery. Key benefits include:
- Detecting force imbalances that aren't visible during standard exams.
- Providing real-time data on pressure distribution during activities like running or jumping.
- Supporting injury prevention by identifying risky loading patterns.
- Helping athletes return to sport safely by monitoring recovery progress.
Pressure mapping systems typically consist of sensor pads (rigid platforms or in-shoe insoles), an electronics unit, and software for visualizing data. These systems are valuable tools for understanding how improper load distribution is associated with injuries like chronic ankle instability, plantar fasciopathy, and Morton's neuroma. Combined with tools like motion analysis and muscle testing, pressure mapping offers a precise way to characterize mechanical contributors to sports injuries, when combined with other clinical assessments.
Biomechanics of Load Distribution and Sports Injuries
Load Distribution and Center of Pressure (CoP)
Every step, jump, or quick direction change an athlete makes applies mechanical forces to specific areas of the foot. In a healthy foot, these forces spread across a broad area, reducing stress on any single point. However, biomechanical issues can cause these forces to concentrate in smaller regions, leading to increased tissue strain.
The Center of Pressure (CoP) represents the average of all ground reaction forces acting on the foot at a given moment. During normal walking, the CoP follows a smooth trajectory from the heel to the forefoot. Any deviation - like a sudden lateral shift - can indicate biomechanical problems. For instance, during static standing, the hindfoot typically supports about 60% of body weight, while the forefoot handles the remaining 40%. Even minor imbalances can trigger compensatory movements throughout the body, setting the stage for abnormal pressure patterns and related injuries.
Common Abnormal Pressure Patterns in Sports
Different injuries leave unique pressure signatures. For example:
- Chronic Ankle Instability (CAI): Athletes with CAI often show increased pressure on the lateral midfoot and rearfoot, reflecting a tendency toward supination and inversion. The first 200 milliseconds after landing are particularly risky for re-injury.
- Plantar Fasciopathy (PF): Athletes with PF typically exhibit pressure concentrated on the medial metatarsals and the medial longitudinal arch during static standing. During walking, this load may shift laterally in the midstance phase. A study in the International Journal of Environmental Research and Public Health notes:
"Characteristics of higher plantar loads beneath medial feet associated with rearfoot valgus in bipedal static stance could be the traceable features for PF-related foot diagrams."
- Morton's Neuroma: This condition shows increased pressure on the lateral metatarsals (p = 0.003) and the medial heel (p = 0.004). Among collegiate athletes, cases often localize in the third intermetatarsal space - 87.5% in the left foot and 71.4% in the right foot. This aligns with the typical lateral metatarsal overload seen in the condition.
These abnormal patterns not only indicate existing issues but may increase the risk of developing new injuries over time.
How Load Distribution Leads to Injury
Abnormal pressure patterns do more than reflect current injuries - they actively contribute to injury development. When force repeatedly targets a small area, tissues experience microtrauma faster than they can repair. This process can lead to overuse injuries like stress fractures, plantar fasciitis, and nerve compression.
Compensation for abnormal pressure often shifts the load to adjacent areas, creating additional strain. Pressure mapping can identify these compensatory shifts using asymmetry indices (AI). Some clinicians use asymmetry indices (AI) to flag notable differences. Values around 20% or higher are sometimes considered meaningful, but there is no universally agreed clinical cutoff in the literature. Left unchecked, these shifts can lead to secondary injuries in joints and soft tissues. For example, excessive lateral pressure during landing may increase tensile stress on the lateral ligament complex, potentially increasing its vulnerability. Research in Frontiers in Bioengineering and Biotechnology emphasizes:
"The increased lateral pressure during landing may exert excessive tensile stress on the ligament... exacerbating the vulnerability of the lateral ligament complex."
This knowledge is vital for developing precise rehabilitation strategies in sports medicine.
The table below highlights correlations between pressure patterns, injury types, and foot postures:
| Injury Type | Static Pattern | Dynamic Pattern | Associated Foot Posture |
|---|---|---|---|
| Chronic Ankle Instability | Increased lateral rearfoot load | High lateral pressure during landing | Increased inversion/plantar flexion |
| Plantar Fasciopathy | Medial metatarsal/arch overload | Shift to lateral forefoot at midstance | Rearfoot valgus (pronated) |
| Morton's Neuroma | Lateral metatarsal & medial heel load | Compensatory shift to healthy limb | Rearfoot varus & hallux valgus |
Recognizing these pressure patterns allows clinicians to pinpoint the mechanical causes of injuries, paving the way for targeted interventions that address the root of the problem.
How Pressure Mapping Is Used in Sports Injury Rehab
Initial Assessment and Baseline Data Collection
Right after an injury, clinicians turn to pressure mapping to get a detailed and objective look at how an athlete distributes weight on their body. This system measures key metrics like peak pressure (kPa), maximum force (N), contact area (cm²), and contact time across up to 15 different foot regions - from the medial hindfoot to specific metatarsal heads. This breakdown is crucial because looking at the foot as a whole can hide areas where pressure is dangerously concentrated.
By comparing the injured limb to the uninjured one, clinicians can precisely measure how much weight an athlete is shifting away from the painful area. For example, research on ACL reconstruction patients revealed that even six months after surgery - when quadriceps strength had largely returned - patients still showed a significantly smaller hindfoot contact area (p = .035) on the injured side. Karolína Matov from Masaryk University highlighted this:
"Plantar pressure analysis may complement return-to-sport evaluation by revealing hindfoot asymmetries persisting despite strength recovery."
Getting a baseline early on is critical, as it provides a personalized starting point to track progress. These initial metrics are the foundation for tailoring treatment plans.
Guiding Treatment and Equipment Adjustments
Once baseline data is collected, it directly influences treatment strategies. For example, if mapping reveals excessive hindfoot pressure, clinicians might recommend specific orthotic or offloading devices designed to reduce hindfoot peak pressure. However, studies show that such offloading can shift load to other regions of the foot, underscoring the need to monitor for compensatory midfoot or forefoot overload with pressure mapping. Without pressure mapping, such compensatory overload might go unnoticed.
Pressure data also supports gait retraining, offering athletes real-time visual feedback to correct subtle compensatory movements - like favoring the outer edge of the foot - that they might not even realize they're doing. Still, as Kendra Betz, PT, from the VA Puget Sound Health Care System, points out:
"Pressure mapping by itself does not provide enough information to come up with a treatment or seating plan."
This means the data works best when combined with a broader clinical assessment, including evaluations of strength, range of motion, and overall movement patterns.
Pressure mapping doesn't just guide immediate treatment - it also plays a key role in tracking recovery.
Tracking Recovery and Return-to-Play Decisions
As rehab moves forward, pressure mapping becomes a progress monitoring tool. One key metric is the Factor of Imbalance, which measures asymmetry between limbs. Early in recovery, this imbalance can be close to 100%, meaning the injured side is barely bearing any weight. In some protocols, a return to play is considered when this figure drops to around 10% or lower, alongside other clinical and functional criteria.
A 2025 case study from Saarland University followed a patient recovering from revision surgery on a distal tibial fracture. Using Moticon sensor insoles over 12 weeks, they tracked ground reaction forces on the injured leg rising from nearly zero to over 1,000 N, while the Factor of Imbalance dropped to about 10%. This objective data marked the transition from crutches to full weight-bearing. Sports performance scientist Antonio Robustelli summed it up:
"Plantar pressure mapping technology represents one of the best fits into the decision-making process for RTS [Return-to-Sport]."
For return-to-play decisions in real-world settings, in-shoe sensor systems are particularly effective. Unlike rigid lab platforms, these systems capture data across multiple sport-specific movements, offering a more accurate picture of how athletes load their bodies during actual performance.
Pressure Mapping with Brittany Bearden from Tekscan
Pressure Mapping by Sport and Injury Type
Wheelchair Cushion Types: Peak Pressure & Performance Comparison
Understanding how pressure mapping varies across sports helps tailor solutions for specific injury prevention and rehabilitation needs. Below, we explore how different sports exhibit unique load distribution patterns, providing insights into targeted strategies.
Running and Track Sports
Running places repetitive, high-impact stress on the body, and pressure mapping captures these effects in detail. For example, as the gastrocnemius (calf muscle) fatigues during a run, there's a noticeable drop in peak pressure at the hallux (big toe) by 32% and at the lesser toes by 31–34%. At the same time, pressure at the medial heel increases by 7.2% to 11%. These shifts can signal a reduced ability of the forefoot to absorb shock, potentially leading to metatarsal stress fractures.
"Running-induced fatigue reduces lower limb muscle activity, diminishes shock absorption, and alters plantar pressure distribution, thus increasing the risk of running-related injuries such as stress fractures in the foot." - JMIR Human Factors
Adjustments like increasing arch support can redistribute peak pressure away from overloaded regions of the forefoot and rearfoot toward the arch and midfoot. Center of pressure (CoP) velocity has proven especially useful in detecting subtle biomechanical changes, making it a key metric for evaluating insole modifications. Wireless systems, such as Kinetyx SI, have been developed to provide high‑fidelity plantar load data in the field, though specific accuracy values depend on the device and validation study.
Court and field sports bring their own pressure-related challenges, often linked to specific injury risks.
Court and Field Sports
Athletes with Chronic Ankle Instability (CAI) can show altered center‑of‑pressure trajectories and increased COP acceleration during stance and posture transitions, consistent with impaired postural control. They also show higher center of pressure velocity (vCoP), highlighting impaired neuromuscular control. To compensate for ankle instability, these athletes often rely on hip-dominant movement strategies, which can mask underlying dysfunctions not identified by standard strength tests. Similarly, individuals recovering from ACL reconstruction may continue to show reduced hindfoot contact and lower midfoot forces even after regaining muscle strength.
"The CAI group predominantly uses the hip joint strategy... ankle joint dysfunction is revealed by single-leg postural control with knee immobilization." - Takanori Kikumoto et al., Niigata University of Health and Welfare
Wearable technology is proving invaluable in these scenarios. For instance, smart socks with built-in textile sensors provide real-time feedback on medial-lateral CoP shifts during dynamic movements like squats and lunges, and can be used alongside exercise programs such as FIFA 11+ to monitor how athletes control medial‑lateral loading.
Adaptive sports also require specialized pressure mapping solutions to address unique challenges.
Shocking Look Inside a Torn ACL (Cadaver Dissection Revealed)
Wheelchair and Adaptive Sports
In wheelchair sports, dynamic pressure mapping during training is vital for identifying repetitive high-pressure areas that could lead to injuries. Research on elite wheelchair basketball players revealed that athletes with existing pressure injuries experienced longer durations of high interface pressures at the ischial region during sessions than players without such injuries, consistent with known pressure‑ulcer risk patterns.
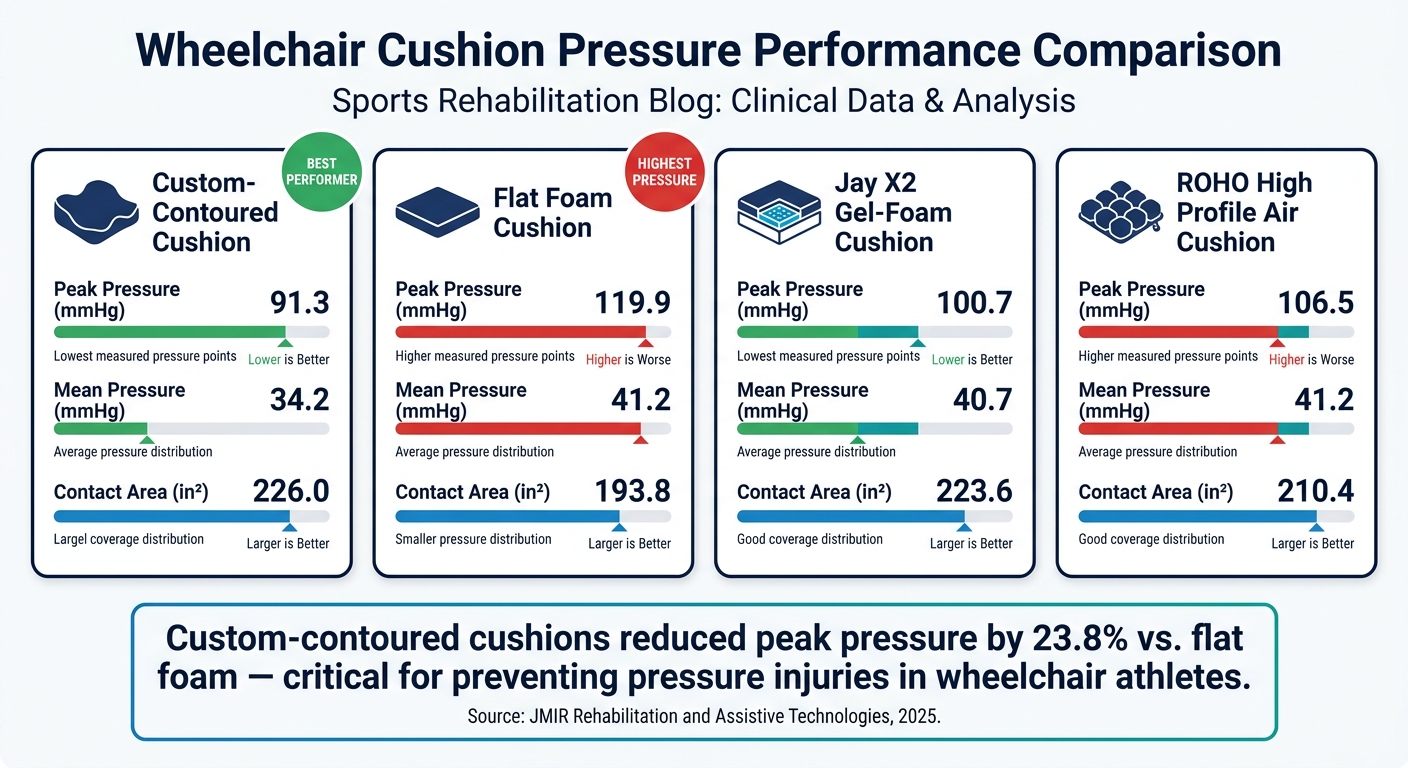
Equipment setup plays a major role in pressure distribution. A study from the University of Illinois found that greater seat dump angles and higher backrests reduced peak pressure at the ischial tuberosity in elite wheelchair basketball players. Meanwhile, research from Universidad Iberoamericana demonstrated that custom-contoured cushions significantly reduced peak pressure compared to flat foam or air cushions. Using BodiTrak BT1510 pressure mats, they created 3D surface models for CNC-milled cushions, achieving a mean peak pressure of 91.3 mmHg, outperforming other options like ROHO high-profile air cushions (106.5 mmHg) and flat foam (119.9 mmHg).
| Cushion Type | Peak Pressure (mean mmHg) | Mean Pressure (mean mmHg) | Contact Area (mean in²) |
|---|---|---|---|
| Custom-Contoured | 91.3 | 34.2 | 226.0 |
| Flat Foam | 119.9 | 41.2 | 193.8 |
| Jay X2 (Gel-Foam) | 100.7 | 40.7 | 223.6 |
| ROHO High Profile (Air) | 106.5 | 41.2 | 210.4 |
(Source: JMIR Rehabilitation and Assistive Technologies, 2025) [21]
Combining Pressure Mapping with Other Assessment Tools
Pressure mapping helps identify how load is distributed, but it doesn’t explain why that distribution occurs. Pairing it with other tools provides a fuller picture of performance and movement patterns.
Pressure Mapping and Motion Analysis
By combining in-shoe pressure mapping with 3D motion capture, you can directly connect foot-ground interactions to joint responses. Sports biomechanics expert Antonio Robustelli highlights the value of this approach:
"Matching what happens during the foot‑ground interaction with a visual observation of how the joint systems move and respond to the application and transmission of forces."
Motion capture systems generally fall into three types:
- Optical systems: High-accuracy, lab-based setups.
- IMU-based systems: Portable and field-friendly.
- Markerless AI-driven systems: Quick to set up but with variable accuracy.
For rehabilitation, IMU systems combined with in-shoe pressure sensors often strike a good balance between precision and practicality.
In 2024, the UK Sports Institute used this integrated approach to evaluate an athlete recovering from ACL reconstruction. They employed an 18-camera Qualisys 3D motion capture system alongside Kistler force plates. The data revealed increased knee valgus and reduced knee extension torque. Adam Mattiussi from the UK Sports Institute's Performance Rehabilitation team explained:
"The full value of 3D motion capture lies in its ability to: support or challenge clinical impressions; reveal compensatory strategies that may not be visible to the naked eye; quantify changes over time; and add confidence to decision‑making."
To manage the substantial data these systems generate, start with a focused clinical question. For example, ask, "Is this athlete offloading their knee during a single-leg squat?" This targeted approach ensures the analysis remains relevant and actionable, making it easier to evaluate muscle activity in rehabilitation.
Pressure Mapping and Muscle Testing
While pressure mapping shows how load is distributed, surface electromyography (sEMG) reveals the muscle activity behind those patterns. Using both tools together helps clinicians pinpoint neuromuscular issues, such as weak stabilizers, overactive muscles, or delayed activation.
A 2025 study in Scientific Reports showcased this combined approach with 50 athletes at Dring Stadium in Bahawalpur. Researchers used Xsens IMUs and Delsys sEMG electrodes to monitor the knee, hip, and shoulder joints in real time. The system flagged key predictors of injury risk, including muscle-force imbalances over 15% and joint-angle asymmetries greater than 10°. This hybrid model achieved an impressive 92.3% accuracy in classifying injury risks, with feedback provided in just 188 milliseconds.
"Early detection of joint‑angle asymmetry (> 10°) and muscle‑force imbalance (> 15%) accurately predicted emerging anterior cruciate ligament (ACL) and muscle‑strain risks."
When synchronizing EMG and pressure data, consider electromechanical delay (EMD) - the brief lag between muscle activation and movement. Understanding these delays can refine your interpretation of neuromuscular dynamics and improve clinical outcomes.
Anatomy Education Resources for Clinicians and Students
A solid understanding of anatomy helps clinicians interpret pressure map data more effectively. Recognizing a shifted pressure peak is valuable, but understanding why it shifted requires anatomical knowledge.
The Institute of Human Anatomy offers cadaver-based courses that visually connect pressure mapping findings to internal structures. Their interactive lessons, videos, and digital study guides help healthcare professionals bridge the gap between anatomy and biomechanics. Co-Founder Jonathan Bennion, with over 15 years of teaching experience, brings expertise to these resources. Tools like the Exploring the Muscular System eBook are particularly helpful in translating pressure map data into insights about the underlying biomechanical processes.
Conclusion
Pressure mapping has moved far beyond the confines of research labs. Today, it empowers clinicians to make quick, informed decisions about load distribution, movement quality, and readiness for returning to sport - offering additional insights beyond those available from periodic assessments alone.
When combined with tools like motion capture, sEMG, and a deep understanding of anatomy, pressure mapping becomes a valuable tool in rehabilitation when used alongside other clinical assessments. As Antonio Robustelli aptly stated:
"Plantar pressure mapping technology represents one of the best fits into the decision-making process for RTS."
The real value lies in interpreting the data. For instance, identifying a shifted pressure peak under the 3rd metatarsal head or spotting an uneven heel strike pattern is just the beginning. The true clinical impact comes from understanding the anatomical structures behind these patterns. Resources like the Institute of Human Anatomy bridge this gap, linking biomechanical observations to the muscles, joints, and tissues at play.
This approach delivers tangible benefits. Research supports its effectiveness: in one randomized trial, runners who actually received correct real-time feedback from pressure-sensing insoles had a lower injury rate in an as-treated analysis (Hazard Ratio 0.53), although the primary intention-to-treat analysis did not show a significant difference between groups, so these findings should be viewed as preliminary.
As technology advances - with sensors becoming smaller, costs decreasing, and AI-driven analysis becoming more common - pressure mapping is becoming accessible to a wider range of users, from elite sports facilities to local rehab centers.
The key message is simple: load tells a story. Pressure mapping translates these patterns into actionable insights, allowing clinicians to intervene effectively and track progress with precision.
FAQs
Should I use in-shoe insoles or a pressure plate?
The right option depends on what you're looking to achieve and the environment you're working in. Pressure plates excel in static or barefoot evaluations, making them perfect for studying balance and posture. In-shoe systems, on the other hand, are wireless and designed for dynamic movements, allowing them to track multiple steps seamlessly. If you're focused on footwear or orthotics, insoles provide the detailed analysis you need. For a more comprehensive understanding, the Institute of Human Anatomy offers valuable resources on anatomy and physiology.
What pressure metrics matter most for return to sport?
Key factors to monitor when returning to sports include plantar pressure distribution, symmetry, and the way the foot handles ground forces. These measurements provide useful information about biomechanical stability and may help clinicians reduce the likelihood of reinjury when combined with other assessments during the recovery process.
How do I link a pressure hotspot to anatomy and mechanics?
To link a pressure hotspot to the body's anatomy and mechanics, combine sensor data with an understanding of foot structure and movement patterns. Pressure mapping identifies areas of high pressure, and when this data is paired with gait analysis - like the Center of Pressure path - it uncovers irregular force distribution. This information helps clinicians pinpoint structural issues, such as flat feet or metatarsalgia, and develop specific rehabilitation plans or orthotic solutions to enhance functionality.

